

pyZMultiPlot User Guide
pyZMultiPlot User Guide
- 0. Install and Bootup
- 1. Main Window
- 2. Import Data and Plots
- 3. Remove Method of Imported Data
- 4. Save file
- 5. Misc
0. Install and Bootup
pyZMultiPlot is windows version only.
Download zipped pyZMultiPlot 64 bit or 32 bit version and save in your computer. pyZMultiPlot can be used by unzip that file.
You can save pyZMultiPlot in any folder you want.
pyZMultiPlot boots up by doule clicking pyZMultiPlot.exe or pyZMultiPlot.exe.
Attention:For bootup of pyZMultiPlot, about 15 to 30 seconds are necessary. Please wait until open a main window.
If you save pyZwx.exe in the same folder, pyZwx can bootup from pyZMultiPlot by "Call pyZwx" submenu in the "File" menu.
Return to the top.1. Main Window
Main frame containing main menu appears at an initial bootup. This is the same with pyZwx.
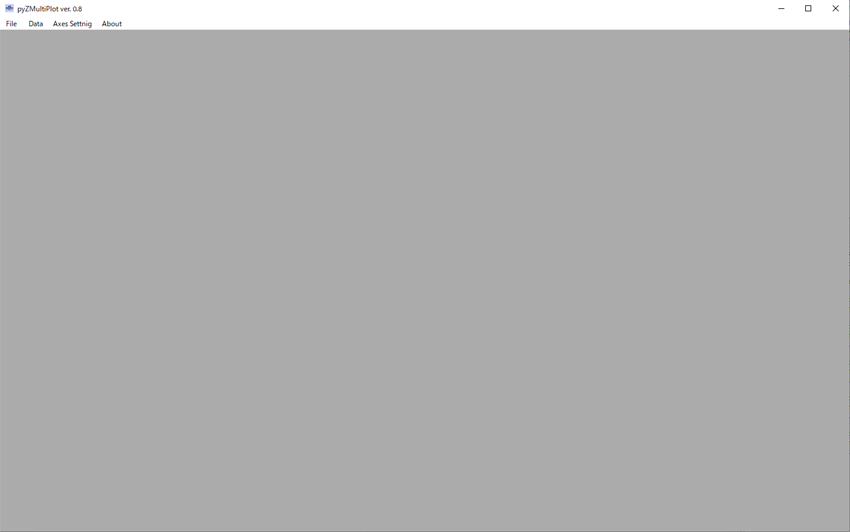
Items of the main menu are the followings:
- File
- Selection of import data files.
- Data
- Selection of remove data files.
- Axis Setting
- Axis setting of displayed plots.
- About
- Display of License.
2. Import Data and Plots
Spectrum data file can be imported by "Load Data File" in "File" menu. User can select multiple files on a file dialog. Following formatting files can be imported without modification.
- z (ZView, Scribner)
- There is possibility to fail importing when a *.z file is generated by a software released by other than Scribner.
- mpt (EC-Lab, BioLogic)
- Regarding to a *.mpt file including multiple spectra data, pyZwx can't import all the data. For such file, you can split each spectrum data by "Split Mpt File" command in File menu. When mpt file is failed to import, please try to split spectrum data using Split Mpt File command.
- Extension name of convert ZView format data by EC-Lab becomes "txt". This file can be imported without modification.
- par (Versa Studio, Princeton Analytical Research)
- *.par file can be imported without modification. Do not convert ZView format by Versa Studio.
- dta(Gamry Framework, Gamry)
- *.dta file output by Gamry Framework ver. 6.3 was confirmed to be importable.
- idf (IviumSoft, Ivium Technologies)
- *.idf file output by IviumSoft ver. 4.9 was confirmed to be importable.
- txt
- Useful delimiters: tab, space, comma. These are automatically identified.
- No headder or one line text hedder for each columns are permitted.
- Data array: frequency, $Z_{\text{real}}$, $Z_{\text{imag}}$. Do not change sign of $Z_{\text{imag}}$.
- SMaRT (Scribner) output file
- Regarding to *.dat file output by SMaRT software (Scribner Associates), exported csv file can be loaded by following procedures by SMaRT.
- Check "Status grid and table/CSV quantitiles" term displayed by "Tools" menu => "Options.." submenu => "Experimence" tab.
- "1" is set at "Impedance" and "Real", and "2" is at "Impedance" and "Imaginary".
- Csv format text is exported by "Export Data File" submenu.
- The extension name is changed from txt or csv to smt.
From the "Load Fitted Results" submenu, analyzed result file (*.fit) saved by pyZwx can be imported. When *.fit files are imported, unmasked data, masked data, and calculated curve are displayed by closed circle, open circle, and solid curve, respectively.
Split Mpt File submenu
User can split each spectrum data file from a *.mpt file including multiple impedance data. The names of splitted files are "[original file name]#[2 ordered number].txt".
If a file is successfully imported, six plots, navigation toolbar for GUI operation of the plots, and list of file names are displayed in the main window.
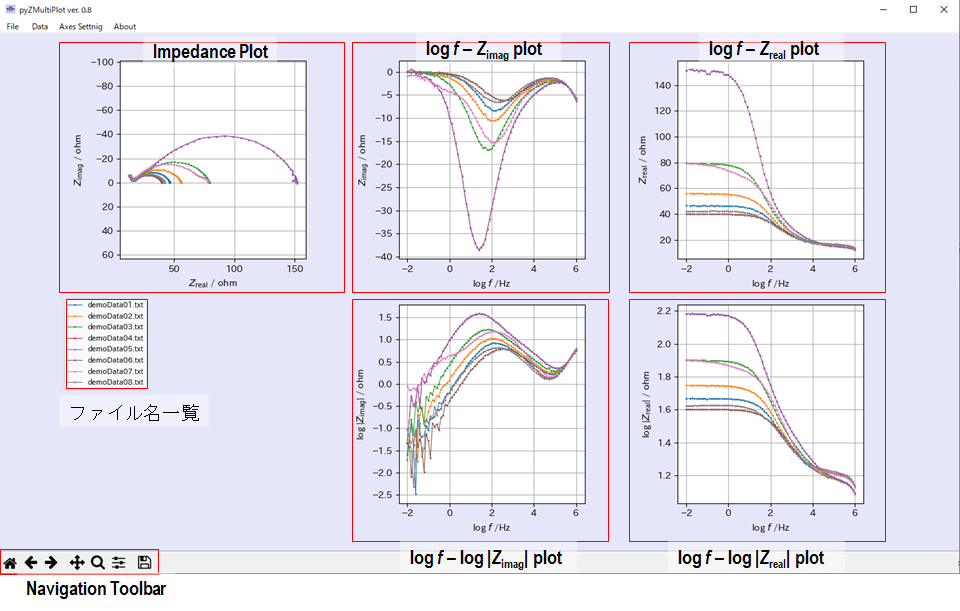
Displayed plots after data import are followings:
- Right side: logarithm of frequency versus (top) real part of impedance (Zreal) and (bottom) logarithm of absolute Zreal.
- Center: logarithm of frequency versus (top) imaginary part of impedance (Zimag) and (bottom) logarithm of absolute Zimag.
- Left side: Impedance (top) and list of import file names (bottom).
Position of data legend and marker and line colors, and their size are impossible to change.
Navigation toolbar is displayed after data import. This tool bar is used for GUI operations of displayed graphs.
The tool bar was implemented using the function of Matplotlib module. About the tool bar, please refer to "Matplotlib vre. 3.1.2 documentaion".
 Return to an initial state button.
 Back state button.
 Forward state button.
 Pan/Zoom button. After pushing this button and move a mouse cursor inside of a graph. Then, mouse is moved with keeping pushing left button,
you can move a graph plot inside that region. If you move the mouse with pushing right button, the plot expands or shrink according to the mouse movement.
Pan/Zoom button. After pushing this button and move a mouse cursor inside of a graph. Then, mouse is moved with keeping pushing left button,
you can move a graph plot inside that region. If you move the mouse with pushing right button, the plot expands or shrink according to the mouse movement.
 Zoom to recutangle button. After push of this button and move a mouse cursor inside of one graph. You can select a zoom up region by dragging the mouse with
 Sub-plot configulation button. You can tune spaces between the graphs.
 Save image button. You can save an image of main window only.
3. Remove Method of Imported Data
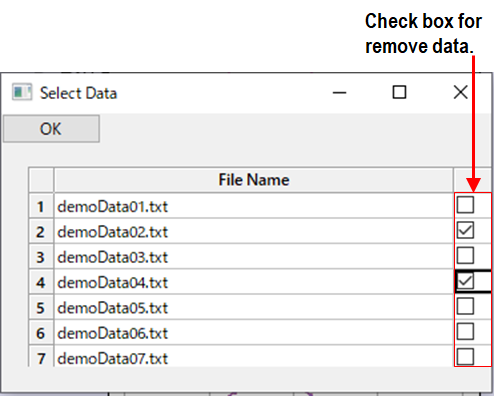
If you want to remove data after import, it is possible to select that data on "select remove data window". That window is opened by "Select Remove Data" submenu in "Data" menu. In that window, file list with check box is displayed. You can remove data if you check corresponding data and push "OK" button.
4. Save File
You can save displayed data from File menu => Save as... The extension name is sdv. The sdv file can be loaded by File menu => Load Saved Data.
5. Misc
pyZMultiplot draws markers connected with line when measured data files are imported. If you import *.fit files, unmasked and masked data are plotted by closed and opened markers, and theoretical curves are drawn by solid curves.
If pyZMultiPlot becomes unstable, please stop pyZMultiPlot and reboot that.