Observation of Water
Cluster and Water film by Non-Contact AFM
Hiroyuki MASUDA
National
Institute for Metals Science
1-2-1
Sengen tukuba Ibaraki, Japan 305
The small water droplets which adhere the
material surface cause corrosion and photo catalytic reaction. So it
is very important to study the behavior of water droplet. The
relation between the humidity and the thickness of water layer is
studied by using elipsometry1), but the detail of the water layer
(shape ,thickness and distribution) is unknown by using elipsometry.
Recently Hu2) et al. succeeded to observe the droplet of KOH solution
by SPFM (Scanning Polarization Force Microscopy) method where the
metal coated tip is located about 40 nm from the specimen and the
voltage is applied to induce the electrostatic force. Modifying this
method, I succeeded to observe the droplet of pure water by
non-contacting AC AFM mode. The average size of water droplet was
about 20 nm in width and 1.5 nm in height. The water droplets and
water film ware observed on both graphite and mica. The behaviors of
these water droplets and film are different from large size of water
and these water droplets do not evaporate more than several days.
In order to get the image of very thin film or
small droplets the specimen surface should be very clean and flat.
Graphite and mica satisfy these conditions, so we chose graphite
(hydrophobic) and mica (hydrophilic) as the test materials. The test
was done at 296 k and humidity of 40% in air. In order to distinguish
the dust in air from water droplets, following four methods were used
for graphite specimen and two methods (1 and 3) for mica specimen: 1.
Observation at the surface freshly created by peeling off the
surface, 2. Observation at the surface peeling off the surface and
sprayed by HFC134a for removing dust, 3. Observation at the surface
peeling off the surface and pouring pure water (deionized and
distilled water) and sprayed by HFC134a. 4. Observation at the
surface peeling off the surface and pouring pure water and dried
naturally (since graphite repels water, no water can be observed
before drying). The tests were done repeatedly at least 3 times to
confirm the reproducibility. The AFM (Atomic Force Microscopy)
observation was done within 5 minutes after peeling off the surface
to avoid the adhesion of dust in air. The AFM device used was
SP3700(SEIKO) and the scan area was 500 nm to 5000 nm and the scan
speed was 1 mm/s to 2.5 mm
/s. The AFM tip was gold coated Si tip, the lever constant is 1.8
nN/m and the oscillation frequency is about 25 kHz.
The AFM mode employed was AC non-contacting mode where the
oscillation width was about 10 nm. The effect of bias on the force
curve at graphite is shown in Figure 1. The average decay of the
amplitude at non-contact region becomes large as the bias increases.
The accuracy of the observation increases as the decay increases.
This means that the accuracy of AC non-contacting AFM observation is
low when no bias is applied while the accuracy increases by applying
the bias. The decay of amplitude becomes large as the distance form
the sample approaches to zero. We used the bias of 0.5 V to 2.5 V and
the distance from the sample few nm to get the image.
Mono-layer and multi-layer step were observed on the AFM image of the
graphite surface freshly created by peeling off the surface, but no
dust was observed. The similar images were observed on the graphite
surface freshly created by peeling off the surface and sprayed by
HFC134a. This indicates that the spraying does not make any droplet
on the graphite surface. Figs. 2 show the AFM image of the graphite
surface peeling off the surface and pouring pure water. In Fig. 2(a)
the surface was sprayed by HFC134a and In Fig. 2(b) and Fig. 2(c) the
surfaces were dried naturally. In these cases we could not get a good
image without applying bias, so bias of 0.5 V to 2.5 V was applied.
When surface was sprayed by cleaner gas the density of water droplets
depended on the time spent for pouring water and the delay for
spraying. A number of water droplets composed of smaller water
droplets ( may be water cluster) were observed and they tended to
gather at step when the density of water droplets was low. The size
of water droplets adhered at step were usually smaller than the other
droplets. While when the surface was dried naturally the density of
water droplets was very high. Sometimes the surface was covered with
water film of about 0.6 nm in thickness as shown in Fig. 2(c). These
water droplets were very stable and did not evaporate more than
several days. Fig. 3 shows the formation of very thin water film of
about 0.3 nm in thickness (may be mono layer) at slow scanning (0.5
mm /s) area. The mechanism of formation of
the water layer at slow scanning area is unknown. Once water film is
produced the shape of water film was always changed while the
location of water droplets did not change. These water droplets were
easily moved. Figs. 4 show the movement of water droplets by contact
mode scanning. The force applied during contact mode scanning was 1.8
nN. The contact mode scannings were done only in the middle region of
the image. The water droplets were moved by scanning and the small
water droplets join together to become a big droplets. The water film
could not removed perfectly by this scanning as shown in Fig. 4(b).
The sizes of small water droplets (may be water cluster) were between
15 nm and 25 nm in width and 1 nm and 2.5 nm in height as shown in
Figs. 2. The tip used was the gold coated one and its radius of
curvature R was around 20 to 30 nm. If we assume the shape of the
water droplet is hemisphere, the expanding ratio of image by the tip
is expressed as (2R/r+1)1/2. Where r is the radius of curvature of
water droplet. Using this equation by assuming the tip radius of
curvature is 25 nm, the expanding ratio of width becomes 5.1 when the
height of water droplet is 2 nm. This indicates the hemisphere shape
of water droplet of 2 nm in height is observed as the water droplets
of 20 nm in width. From this result there is a possibility that the
width of these water droplets is around 4 nm.
In the case of mica no step and no dust were observed on the surface
freshly created by peeling off the surface. Figs. 5 show the AFM
image of the mica surface peeling off the surface and pouring pure
water and sprayed by HFC134a. In most cases surfaces were covered by
water film of about 1 nm thickness. The size of water droplets on
mica was almost the same as that on graphite. The difference of
morphology from graphite was the existence of thick water film.
1)Doi et.al: Fushoku Boushoku ‘96 (1996)71
2)Jun Hu etal.: Appl. Phys. Lett.,67 (1995)208
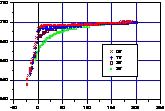
Fig.1 Effect of bias on force curve. The decay at non-contact region
incereses as bias increses.
(a)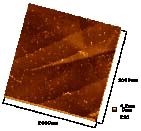 (b)
(b)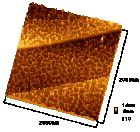 (c)
(c)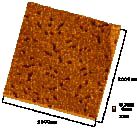

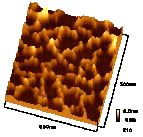

Figure 2 AFM image of graphite surface peeling off the surface and
pouring water. (a) sprayed by cleaner gas. (b) and (c) dried
naturally. Most of surface was covered by water film of about 0.6 nm
thickness at (c).
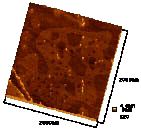
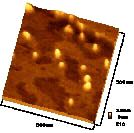
Figure 3 Formation of thin water film (about 0.3 nm) at low scanning
area.
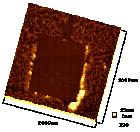
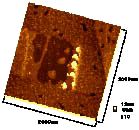
Figure 4 Movement of water droplets and film by contact mode
scanning. Contact mode scanning was done only in the middle of the
image. The small water droplets join together to become big water
droplets at the boundary of scanning.
(a)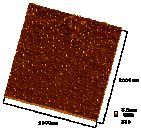 (b)
(b)
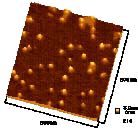
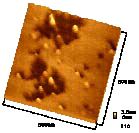
Figure 5 AFM image of mica surface peeling off the surface, pouring
water and sprayed by cleaner gas. Surface was covered by water film
of about 1 nm thickness at (b).