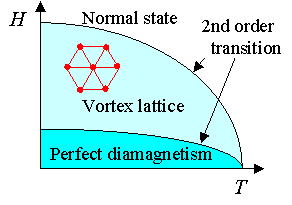
Fig.1 : conventional phase diagram
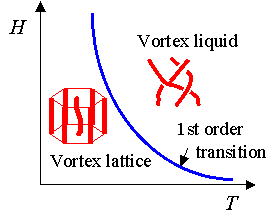
Fig.2 : phase diagram of HTSC

Fig.3
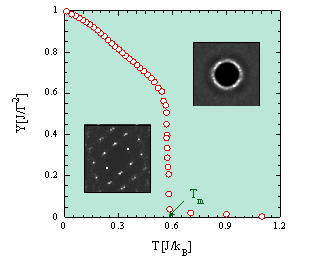
Fig.4
Phase transition and phase diagram in vortex states
| The conventional T-H phase diagram of a type-II superconductor consists of three phases; the Meissner phase where magnetic fields are totally expelled, the vortex lattice phase where the vortices form a regular (triangular) lattice, and the normal phase (Fig.1). This is based on a mean field analysis, which becomes inapplicable in the HTSC due to the large thermal fluctuations. A new picture had been advanced in its place, where the vortex lattice undergoes a melting transition (just like the melting of an ordinary crystal lattice), leading to the destruction of superconductivity (Fig.2). Despite some experimental indications of such behavior, the precise thermodynamic properties of the transition had not been evaluated. | Fig.1 : conventional phase diagram Fig.2 : phase diagram of HTSC |
Fig.3 |
Fig.4 |
| Here we show our results on such studies . The prominent peak in the specific heat shown in Fig.3 corresponds to the first order melting transition, as evidenced from the change in the structure factors above and below this point. This is also accompanied by the Vanishing of the helicity modulus Y which measures the superfluidity of the system (See Fig.4). Our results show that the melting of the vortex lattice can show up in thermodynamic quantities. A similar specific heat peak was independently confirmed in experiments at around the same time. |
![]()
![]()
![]()
![]()